Who’s using my bandwidth?
It’s one of those questions you often don’t think about until you start running into problems. You’re hitting the bandwidth limit of some link but not sure what to blame it on.
The pretty traffic graphs you’ve created via. Cacti (or similar) will only get you so far. That’s when you need to start looking at flows.
While this article is really a how-to in tracking traffic flows in Mikrotik routers using ntop on Debian boxes (including Raspberry Pis), I do intend to cover a little bit what the NetFlow protocol is.
NetFlow is a Cisco protocol for monitoring and sampling traffic flows on a network interface. The probe, which is usually a router, will determine separate flows based on the interface, source address, destination address, source port, destination port, layer 3/4 protocol and TOS/QoS marker.
This statistical information is sent by the probe to a collector, which is usually software running on a server. UDP is used as the transport protocol meaning it’s possible to lose some of the data.
Either way, most collectors will do some useful statistical analysis on the data. As an example, historical and 95th percentile data is kept.
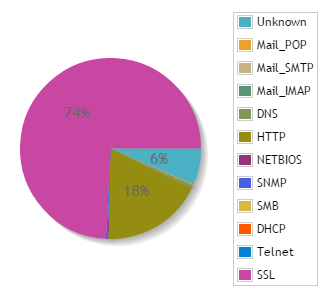
This will be used to generate pretty graphs and reports for you. As an example, you can see that my home network is mainly SSL and HTTP traffic:
One import part of using Netflow is deciding where to collect data from. In a simple home network with a single router, that’s the point you want to use. But what about a more complex network like this:
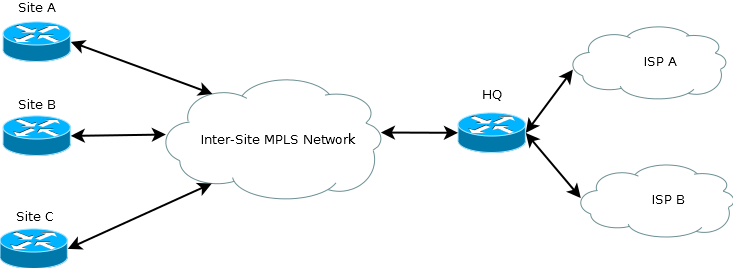
Well, it depends on what information you want to capture. You could run NetFlow on the spoke site routers in the hope of seeing what’s saturating the links into the MPLS network. Running NetFlow on the HQ router’s interfaces to ISP A and ISP B would show what’s going on with your ISP links.
The important bit to take away is that NetFlow is only useful if the router can see the traffic on its interface. It would be pointless running it on the Site A router if you really wanted to know what’s going on with traffic to and from your ISP.
In reality, you’d probably be monitoring in multiple locations on complex networks. Especially if you have the CPU and storage resources to spare.
While NetFlow is a Cisco protocol, a number of other vendors have implemented it. This is what we’ll be taking advantage of by making a Mikrotik router send data to an ntop installation on a Raspberry Pi.
Before we really get going, I will remind you that this is a guide to purely setting up the system and getting it running. We won’t be covering access control, locking down or hardening the system. That’s for you to explore and investigate in your own time, something I strongly advise you do.
Anyway, let’s crack on with configuring ntop on the Rasbperry Pi. You’ll need a Pi with a reasonably recent version of Raspbian installed and a static IP address configured.
SSH into (or get a direct console on) the Pi and enter the following command to install ntop:
apt-get install ntop
You’ll be asked for an admin password for ntop. Make it a reasonably strong one. However, you will need to remember it for accessing the web interface later.
For a basic installation, that’s it. ntop will now be up and running on port 3000. Try making a connection in your web browser now. You should be presented with an ntop welcome page.
You now want to select Plugins –> NetFlow –> Activate. That’ll do as it says and activate the NetFlow plugin.
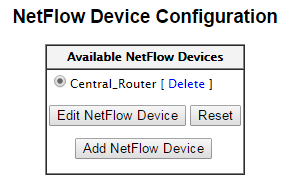
In order for ntop to process the data, you’ll need to create a “NetFlow Device”. To do this, select Plugins –> NetFlow –> View/Configure in the menus. Click on “Add Netflow Device”.
We’re going to assume you’re configuring a simple single subnet system here. You’ll need to do the following:
- Give the device a name and click on “Set Interface Name”.
- Give the collector a port number then click on “Set Port”. The default port for NetFlow is 2055. Make a note of whatever number you use.
- Set the probe’s IP address and netmask, then click on “Set Interface Address”. This is used, among other things, to determine what are local and remote hosts.
Once you’ve done that, you’ve got a really basic configuration up and running. It’s possible to get a bit more clever with features like aggregation but it’s not required for our simple setup.
You can now go to Plugins –> NetFlow –> View/Configure. The interface you configured should now be listed.
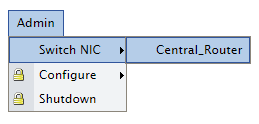
The final step in ntop is to make your new NetFlow probe the active interface. To do this, select Admin –> Switch NIC –> YOUR_INTERFACE_NAME from the menus.
We can now look at configuring the router to observe the flows and send the data on to ntop. To do this, SSH into your Mikrotik router and you’ll be presented with a console.
Enter the following commands to configure NetFlow to collect on all interfaces:
/ip traffic-flow
set enabled=yes
target
add address=X.X.X.X:2055 version=9
Where X.X.X.X:2055 should be replaced with the IP address and port configured in ntop. You can confirm that the collector is configured using the print command:
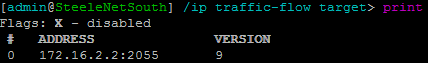
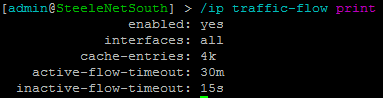
Typing in /ip traffic-flow print will confirm that NetFlow is enabled and what interfaces it’s configured for.
Assuming all is well, you should now be able to go into ntop and start exploring the data collected about your network.