Naively Detecting Pivots with NetFlow
The experiment started with a simple question – can you detect interesting behaviour with only NetFlow data? There are numerous tools on the market that can do this will full network taps but that’s not always practical. Doing clever stuff with deep learning would be interesting but isn’t feasible on the computing resource available to me. That Raspberry Pi would be well cooked training even a relatively simple model.
Pivoting counts as interesting behaviour to me. It’s gaining a foothold in one system and using it to move onto other systems. The whole range of protocols and techniques used to make the jump make spotting it tricky. This approach appears in Capture the Flag (CTF) exercises and your local sysadmins may also be doing the same thing.
There are numerous times I’ve used a box I can SSH, RDP, etc. into and used it to bounce onto a more isolated system. While it’s technically a hole in your security stance, it’s increadibly useful in an emergency.
To spot these flows, the plan is to look for “interesting” network flows in the NetFlow data sent by a switch. In this case, it’s just a bunch of specific protocols we’re looking for through dumb port matching. Specifically, SSH, WinRM and RDP.
Once we find a match, we then go on to look for interesting flows eminating from the destination of the flow we matched on during the same time period. Iterate down these child flows until you’ve exhausted your options and you should end up with a graph of interesting flows starting from a single point.
The naivity comes from the fact we don’t have details about what user accounts are being used, who is also making use of shared server, etc. We’re assuming the person making the connection from A to B is also making any connections in the same timeframe from B to C, D, E. Without further insight into the machines or flows involved, that’s as clever as we can get.
We’re also oblivious to any non-standard port use. The reason why simply firing up iptables with some simple layer 4 rules isn’t enough any more. You need deeper inspection to make sure that’s really DNS and not data exfiltration or command and control traffic on UDP port 53.
The challenge sounds simple enough. The results:
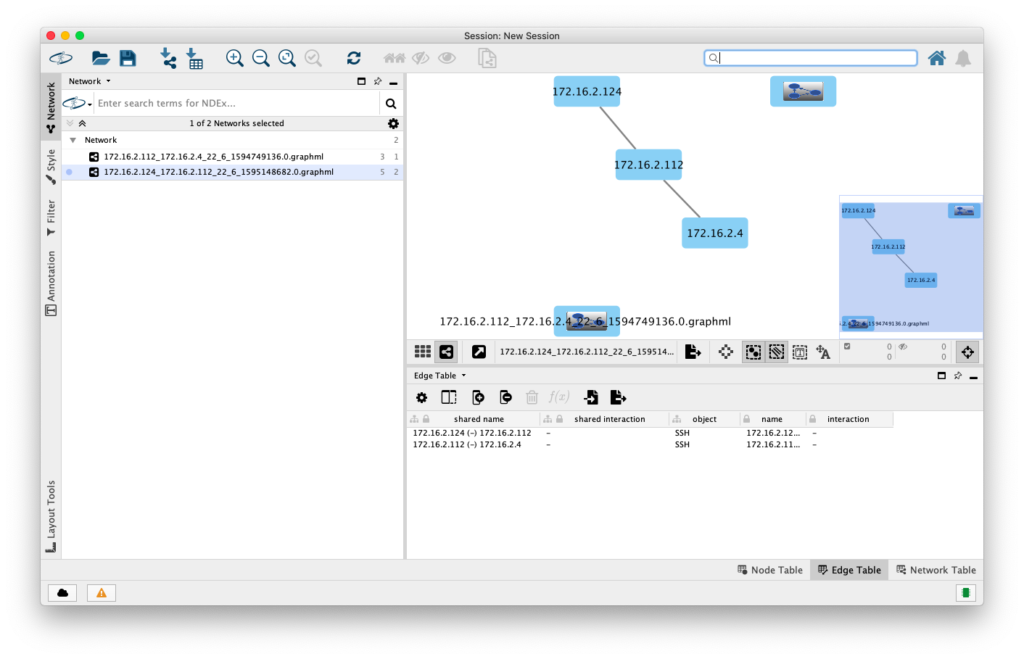
Some success! Admittedly with a rather contrived SSH from 172.16.2.124 to 172.16.2.112 then opening another SSH connection on to a server at 172.16.2.4 but it worked!
The source code is over at GitHub and consists of a collector, data store and analytics component. It’s definitely NOT scalable – PostgreSQL can do a lot but we’d probably want to spread the load out using something like a message bus and data sharding.
I do have some Elastiflow instances kicking around that may make for an interesting data source to run the next experiment with. Though those are fed from boundary firewalls meaning we won’t see any east/west moves.
On top of that, searching for flows and building the graph is basically a brute force task. It could be parallelised somewhat but unfortunatelty my rusty graph theory says you’ve got to visit every node / edge to build the graph.
On the plus side, I’ve learned a few lessons along the way. First is a network configuraiton issue. To get the traffic, a Mikrotik router was configured to act as a switch (almost like an old fashioned hub) and generate the NetFlow data. Simply turning on NetFlow (or Traffic Flow as it’s called on the Mikrotik software) results in missing flows.
Turns out the firewall needs to be part of the packet processing chain. Running the command /interface bridge settings set use-ip-firewall=yes does the trick. That SSH connection you’re trying to spot now appears.
The next issue to overcome derives from the NetFlow standard. A quick look at the Cisco documentation for the protocol shows that flows (FlowSets) are logged with start and end times referencing the uptime of the system that sent it. The uptime and UNIX timestamp of the message are in the header meaning it’s not a show stopper. A bit of simple maths and you’ve no longer got flows from 1970.
The remaining issues with NetFlow are issues you may have encountered with off the shelf flow collectors. With version 9, you can’t decode any flows (FlowSets) until the templates for the data structure are sent. Transmissions of these can be minutes apart so we have to hold a buffer of flows we can’t decode until we see the templates.
Devices generating NetFlow data may not actually be aware of the direction of a flow. You may see duplicated records for each direction. I tried to catch this with the storage logic but it needs a bit more work.
Next steps if I ever find the time would be scaling up to more complex pivots, adding context to the flows or simply improving the data storage / processing and visualisation elements. The codebase would probably need to be started again from scratch at that point.
If you’re planning on running the code yourself, I’ll admit it’s not the prettiest I’ve ever written but does generally work. There’s a Python requirements file for setting up the virtual environment and you’ll need something like Cytoscape to view the GraphML files generated.
Given this was a quick and dirty experiment using the example NetFlow collector code as a starting point, it’s a rather surprising success.