Polling Elasticsearch Queries through SNMP
We’ve got a technical problem that sounds simple to fix – what traffic levels are we seeing from a specific set of sources? This traffic passes through a firewall (Sonicwall) appliance and even as individual VPN tunnels in some cases. Normally, you’d simply monitor traffic levels by pointing an SNMP poller at the device and looking for the matching interface. The bad news is that the way our VPNs were set up, the Sonicwall only provides statistics at a security association (SA) level through SNMP. That means every time the SA drops or changes keys, a brand new SNMP OID is assigned. No good for long term monitoring!
As part of a wider project looking at analysing traffic, we’ve got an Elastiflow instance running. It’s Elasticsearch, Logstash and Kibana pre-configured to handle IPFIX and SFLOW data. Pumping IPFIX out of the firewall and into this can provide us with the appropriate insights and pretty graphs.

That’s neat but would be even better integrated properly into our “single pane of glass” monitoring system. At the day job, that’s Solarwinds. Integration options here consist of IFRAMEs (no, really) or SNMP values we can actually poll, graph and alert on.
There’s no out of the box solution for presenting Kibana or Elasticsearch data through SNMP. We can however, write a script that perform the appropriate search and delivers result through snmpd’s extension options.
Such a script might look something like this:
'''
Converts Elasticsearch aggregations into SNMP values.
'''
import argparse
import json
import requests
def main():
    '''
    The main script logic.
    '''
    # Process the command line arguments
    parser = argparse.ArgumentParser(
        description='Converts Elasticsearch aggregations into SNMP friendly values.'
    )
    parser.add_argument(
        'settings',
        type=str,
        nargs=1,
        help='The settings file we read from.'
    )
    parser.add_argument(
        'value',
        type=str,
        nargs=1,
        help='The search we want to make (from the settings file).'
    )
    args = parser.parse_args()
    # Load the settings file
    settings = json.load(open(args.settings[0]))
    value_name = args.value[0]
    if not value_name in settings['values']:
        raise Exception(f'{args.value[0]} is not in the list of loaded values we can query.')
    value = settings['values'][value_name]
    # Build up the URI
    if settings['secure']:
        uri = f"https://{settings['server']}:{settings['port']}/{value['index']}/_search" # pylint: disable=line-too-long
    else:
        uri = f"http://{settings['server']}:{settings['port']}/{value['index']}/_search" # pylint: disable=line-too-long
    # Build up our request parameters
    # Start with the common parts
    params = {
        "size": 0,
        "query": {
            "bool": {}
        },
        "aggs": {
            "agg_value": {
                "date_histogram": {
                    "field": value['date_field'],
                    "fixed_interval": f"{settings['minutes']}m"
                },
                "aggs": {
                    value['field']['name']: {
                        value['field']['action']: {
                            "field": f"{value['field']['field']}"
                        }
                    }
                }
            }
        }
    }
    # Time range filter
    must_params = []
    must_params.append(
        {
            "range": {
                value['date_field']: {
                    "gte": f"now-{settings['minutes'] * 2}m",
                    "lt": "now"
                }
            }
        }
    )
    # Add user filters
    if "must" in value:
        for must in value['must']:
            must_params.append({"term": must})
    params['query']['bool']['must'] = must_params
    if "must_not" in value:
        must_not_params = []
        for must_not in value['must_not']:
            must_not_params.append({"term": must_not})
        params['query']['bool']['must_not'] = must_not_params
    # Bucket scripts
    if "bucket_script" in value:
        bucket_script = {
            "bucket_script": {
                'buckets_path': value['bucket_script']['params'],
                'script': value['bucket_script']['script']
            }
        }
        bucket_name = value['bucket_script']['name']
        params['aggs']['agg_value']['aggs'][bucket_name] = bucket_script
    # Make the request
    response = requests.post(uri, json=params)
    if not response.status_code == requests.codes.ok:
        raise Exception(
            f"Failed to make Elasticsearch query for {value_name}. Reason: {response.text}."
        )
    # Parse that sweet sweet JSON
    json_response = response.json()
    if ("aggregations" not in json_response and
            "agg_value" not in json_response['aggregations'] and
            "buckets" not in json_response['aggregations']['agg_value']):
        raise Exception("Cannot find buckets in response!")
    buckets = json_response['aggregations']['agg_value']['buckets']
    max_timestamp = 0
    last_value = None
    for bucket in buckets:
        if bucket['key'] > max_timestamp:
            if bucket_name in bucket:
                last_value = bucket[bucket_name]['value']
            max_timestamp = bucket['key']
    if last_value:
        print(round(last_value))
    else:
        print(0)
# Execute the script
if __name__ == "__main__":
    main()
So, how does it work? Well, the first section of the script is asking for a settings file and which search you’re interested in. It would be a bit wasteful to need different scripts for different searches on the same Elasticsearch box.
A settings file could look something like this:
{
  "minutes": 5,
  "port": 9200,
  "secure": false,
  "server": "localhost",
  "values": {
    "primary_ib": {
      "bucket_script": {
        "name": "bucket_bps",
        "params": {
          "bytes": "sum_bytes"
        },
        "script": "(params.bytes * 64) / 300"
      },
      "date_field": "@timestamp",
      "field": {
        "action": "sum",
        "field": "flow.bytes",
        "name": "sum_bytes"
      },
      "index": "elastiflow-*",
      "must": [
        {
          "flow.src_addr": "10.20.0.0/15"
        }
      ]
    },
    "primary_ob": {
      "bucket_script": {
        "name": "bucket_bps",
        "params": {
          "bytes": "sum_bytes"
        },
        "script": "(params.bytes * 64) / 300"
      },
      "date_field": "@timestamp",
      "field": {
        "action": "sum",
        "field": "flow.bytes",
        "name": "sum_bytes"
      },
      "index": "elastiflow-*",
      "must": [
        {
          "flow.dst_addr": "10.20.0.0/15"
        }
      ]
    }
  }
}
In this example, we’re going to ask for 5 minute averages and connect to Elasticsearch on the local machine. We’ve got two possible searches or values you can query for – primary_ib and primary_ob. Each of those has a bucket script that takes the total data seen for our time period and averages out to a per second value.
As it’s Elastiflow, we can use the timestamp of the Elasticsearch document as our flow time and use the “elastiflow-*” wildcard to find the documents in the first place.
It’s not demonstrated well here but our script allows for multiple must and must_not options to be set. This can let you build as complex or simple a query as you’d like. Our example is about as simple as you can get but you could filter on application, port, flow size, AS number, etc.
With the settings loaded and the matching search found, we plough on to figure out the Elasticsearch URI.
    # Build up the URI
    if settings['secure']:
        uri = f"https://{settings['server']}:{settings['port']}/{value['index']}/_search" # pylint: disable=line-too-long
    else:
        uri = f"http://{settings['server']}:{settings['port']}/{value['index']}/_search" # pylint: disable=line-too-long
Now is where we get a little more complicated – actually generating the Elasticsearch query. As a starting point, we want to search for a bunch of documents (read flows) over a time period and perform some form of aggregation on the data.
 params = {
        "size": 0,
        "query": {
            "bool": {}
        },
        "aggs": {
            "agg_value": {
                "date_histogram": {
                    "field": value['date_field'],
                    "fixed_interval": f"{settings['minutes']}m"
                },
                "aggs": {
                    value['field']['name']: {
                        value['field']['action']: {
                            "field": f"{value['field']['field']}"
                        }
                    }
                }
            }
        }
    }
For most Elastiflow cases, the aggregation will be a sum of flow.bytes in any particular time window. Talking of time windows…
# Time range filter
    must_params = []
    must_params.append(
        {
            "range": {
                value['date_field']: {
                    "gte": f"now-{settings['minutes'] * 2}m",
                    "lt": "now"
                }
            }
        }
    )
    # Add user filters
    if "must" in value:
        for must in value['must']:
            must_params.append({"term": must})
    params['query']['bool']['must'] = must_params
    if "must_not" in value:
        must_not_params = []
        for must_not in value['must_not']:
            must_not_params.append({"term": must_not})
        params['query']['bool']['must_not'] = must_not_params
Adding the filters to the query is where we actually set the window for documents we’re searching. If we don’t set a time window, every document stored and not pruned in Elastiflow indices will be checked. That’s a significant performance hit.
While we’re messing with filters, this is where we add our search terms. What flows are we actually interested in?
Bucket scripts are a nifty little feature in Elasticsearch. They allow us to perform some type of calculation when combining historgram values into buckets.
    # Bucket scripts
    if "bucket_script" in value:
        bucket_script = {
            "bucket_script": {
                'buckets_path': value['bucket_script']['params'],
                'script': value['bucket_script']['script']
            }
        }
        bucket_name = value['bucket_script']['name']
        params['aggs']['agg_value']['aggs'][bucket_name] = bucket_script
At this point, our Elasticsearch query is ready to go. All we’ve got to do is actually perform the search. The rest of our script simple makes the POST request, ensures we got a 200 HTTP code, parses the response and looks for the last bucket (i.e. now). The result is then presented as a rounded integer value or zero if nothing was returned.
You can now test this script by calling it with the settings file and a friendly name you gave your search (primary_ob or primary_ib in our example). Assuming you’re running Python 3 and remembered to get requests through pip, it should return a value.
The next step is to make it available via. SNMP. We do this through the snmpd extend functionality. An example /etc/snmp/snmpd.conf file would look something like this:
sysname elatiflow.domain.local
syslocation Somewhere
syscontact Someone
extend primary_ob /usr/bin/python36 /opt/foo/elastic_snmp.py /opt/foo/elastic_settings.json primary_ob
extend primary_ib /usr/bin/python36 /opt/foo/elastic_snmp.py /opt/foo/elastic_settings.json primary_ib
rouser snmp_ro
We’re assuming you’re using SNMPv3 and configured approriate users (such as snmp_ro) in the /var/lib/net-snmp/snmpd.conf file. If all is good, you should be able to restart the service, perform an SNMP walk and get something useful back
[[email protected] ~]$ snmpwalk -v3 -l authPriv -u snmp_ro -a SHA -A Password1 -x AES -X Pasword2 localhost NET-SNMP-EXTEND-MIB::nsExtendObjects
NET-SNMP-EXTEND-MIB::nsExtendNumEntries.0 = INTEGER: 2
NET-SNMP-EXTEND-MIB::nsExtendCommand."primary_ib" = STRING: /usr/bin/python36
NET-SNMP-EXTEND-MIB::nsExtendCommand."primary_ob" = STRING: /usr/bin/python36
NET-SNMP-EXTEND-MIB::nsExtendArgs."primary_ib" = STRING: /opt/foo/elastic_snmp.py /opt/foo/elastic_settings.json  primary_ib
NET-SNMP-EXTEND-MIB::nsExtendArgs."primary_ob" = STRING: /opt/foo/elastic_snmp.py /opt/foo/elastic_settings.json  primary_ob
NET-SNMP-EXTEND-MIB::nsExtendInput."primary_ib" = STRING:
NET-SNMP-EXTEND-MIB::nsExtendInput."primary_ob" = STRING:
NET-SNMP-EXTEND-MIB::nsExtendCacheTime."primary_ib" = INTEGER: 5
NET-SNMP-EXTEND-MIB::nsExtendCacheTime."primary_ob" = INTEGER: 5
NET-SNMP-EXTEND-MIB::nsExtendExecType."primary_ib" = INTEGER: exec(1)
NET-SNMP-EXTEND-MIB::nsExtendExecType."primary_ob" = INTEGER: exec(1)
NET-SNMP-EXTEND-MIB::nsExtendRunType."primary_ib" = INTEGER: run-on-read(1)
NET-SNMP-EXTEND-MIB::nsExtendRunType."primary_ob" = INTEGER: run-on-read(1)
NET-SNMP-EXTEND-MIB::nsExtendStorage."primary_ib" = INTEGER: permanent(4)
NET-SNMP-EXTEND-MIB::nsExtendStorage."primary_ob" = INTEGER: permanent(4)
NET-SNMP-EXTEND-MIB::nsExtendStatus."primary_ib" = INTEGER: active(1)
NET-SNMP-EXTEND-MIB::nsExtendStatus."primary_ob" = INTEGER: active(1)
NET-SNMP-EXTEND-MIB::nsExtendOutput1Line."primary_ib" = STRING: 0
NET-SNMP-EXTEND-MIB::nsExtendOutput1Line."primary_ob" = STRING: 12987
NET-SNMP-EXTEND-MIB::nsExtendOutputFull."primary_ib" = STRING: 0
NET-SNMP-EXTEND-MIB::nsExtendOutputFull."primary_ob" = STRING: 12987
NET-SNMP-EXTEND-MIB::nsExtendOutNumLines."primary_ib" = INTEGER: 1
NET-SNMP-EXTEND-MIB::nsExtendOutNumLines."primary_ob" = INTEGER: 1
NET-SNMP-EXTEND-MIB::nsExtendResult."primary_ib" = INTEGER: 0
NET-SNMP-EXTEND-MIB::nsExtendResult."primary_ob" = INTEGER: 0
NET-SNMP-EXTEND-MIB::nsExtendOutLine."primary_ib".1 = STRING: 0
NET-SNMP-EXTEND-MIB::nsExtendOutLine."primary_ob".1 = STRING: 12987
If it’s working at this point, you’ve probably go SELinux turned off. Not the best approach to tackling SELinux permissions issues but not wholy unexpected. Either way, it turns out that on CentOS the SNMP user isn’t allowed to open the TCP sockets to connect to Elasticsearch. You can fix this properly by following the Red Hat guide on audit2allow.
One down side of our approach is that the result is presented as an SNMP string. Thankfully, Solarwinds (and some other tools) will happily ingest these as integers. Talking of Solarwinds, we can now add our node but need to create a custom poller. To begin, we need to know our custom OIDs. You can get these through the command line on your Elastiflow box.
snmptranslate -On NET-SNMP-EXTEND-MIB::nsExtendOutputFull.\"primary_ob\"With that information, fire up the Orion Universal Device Poller. Click on New Universal Device Poller and enter the following information:
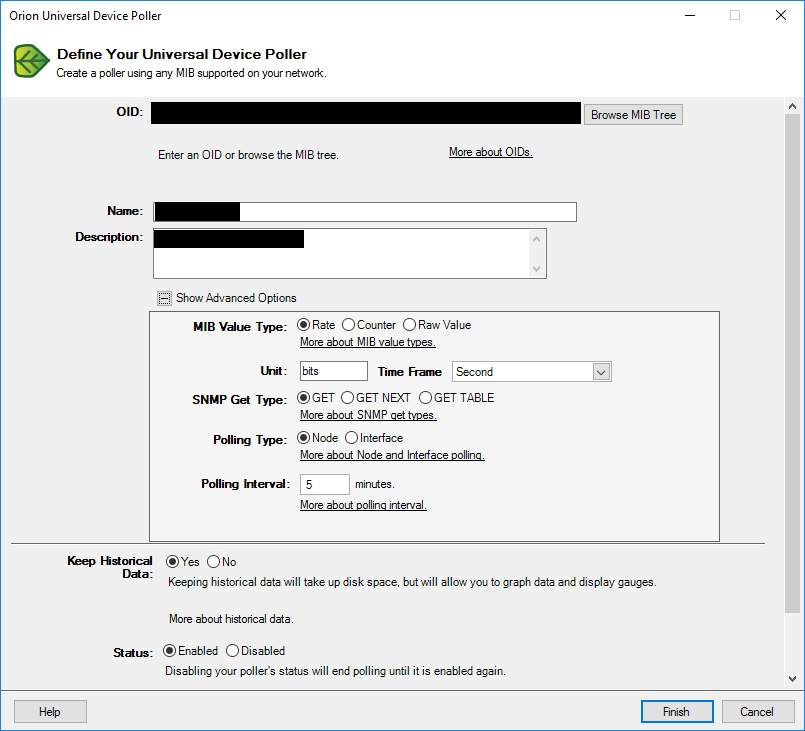
The OID needs to match what your SNMP server says. Our value is a rate in bits/second, we perform simple SNMP GET requests, it’s node rather than interface specific and should be polled at a regular interval (five minutes in our example).
You can assign the poller to a group and the Elasticsearch node. Within a couple of minutes, you should have values coming in. Time to graph them.
We created a new view in the Solarwinds console for this. To present multiple values in one graph, you want the Universal Device Poller Custom Chart which looks something like this:

With that working, you can now go and add any alerting you may want for your Elasticsearch values.